Our Proprietary 10-Day Forecast

Loading Forecast...

Current warnings over Middleton, Wisconsin
Add warnings to your site:
<div style='text-align:center'><a href='https://f5wx.com/warnings/'>
  <img src="https://www.f5wx.com/warnings/warningsF5.gif" alt='F5Weather Warnings Map' />
<p>Warnings from F5Weather</a></div>

United States weather warnings are issued by various organizations under NOAA. Most from the National Weather Service, but also Storm Prediction Center and National Hurricane Center.

Do not use our graphics for protection of life or property. Delays in image processing are possible.

You are free to embed our warning graphics into your web site using the code above. We just ask that you keep a link and credit to F5Weather as a source for the graphics.


View more weather maps.

Zoom Out

Current radar over Middleton, Wisconsin red dot
Add this radar to your site:
<div style='text-align:center'><a href='https://f5wx.com/radar/'>
<img src='https://www.f5wx.com/radar/live/radar_greatlakes.gif' alt='F5Weather Radar'>
<p>Live radar from F5Weather</a></div>

Our radar is based off of US NEXRAD and Canadian weather radar sites through the quality controlled MRMS system. It compiles various sources for radar data and filters out erroneous returns such as sun spikes and ground clutter. We then colorize the precipitation based on our methods for determining precipitation type. Rain is in shades of green, mixed precipitation and freezing rain in shades of pink and snow is in shades of blue.

View more weather maps.

Zoom Out

Current satellite over Middleton, Wisconsin red dot
Add this satellite to your site:
<div style='text-align:center'><a href='https://f5wx.com/satellite/'>
<img src='https://www.f5wx.com/satellite/live/ir_greatlakes.gif' alt='F5Weather Satellite'>
<p>Live satellite from F5Weather</a></div>

Our satellite is from the GOES-16. It is color enhanced by using a geocolor terrain background during the day and black marble city lights at night. The daytime satellite data is Visible satellite imagery, and nighttime uses Infrared bands. The bluish clouds are fog and low cloud. The whiteest clouds are the coldest, highest cloud tops.

View more weather maps.

Zoom Out

Current surface weather map around Dane County, WI

This surface map is from the HRRR computer model. It is a 1-hour forecast, updated hourly, which is a good estimate of the current surface conditions. This map shows the current high and low pressure centers, pressure isobar contours, wind streamlines and thickness contours. It also shows the currently depicted preciptiation estimates, although this should not be a substitute for actual live radar. The purple dashed contour is the 5400m thickness line, which is often a good proxy for the rain/snow line.

View more weather maps.

Zoom Out

Temperatures right now near Middleton, Wisconsin

This is the latest surface temperatures as depicted by the HRRR computer model, updated hourly. Although these are not actual observations, this model is a very good representation of current conditions as it factors in observations, terrain and physics to give you more detailed temperatures in areas that do not have reporting weather stations. For the latest reports at specific locations, like in Middleton, WI please see our current conditions data on the left and right side of this page, or go to our current conditions page.

View more weather maps.

Zoom Out

Surface wind speed map over Middleton, WI

This map shows the latest HRRR computer model winds. This depiction of the current wind directions and speeds is an estimate from the computer model. For actual observations in Middleton, WI, see the current conditions data on the left and right side of this page, or go to our current conditions page.

View more weather maps.

Zoom Out

Regional 24 hour rainfall expected near Middleton, Wisconsin

This is a forecast of the amount of precipitation expected over the next 24 hours from the HRRR weather forecast model. This is only one forecast depiction, and you should check other models to get a better idea of what may happen. You can view this and other models in more detail on our main weather forecast maps page. There, you will also be able to look at forecasts beyond just 24 hours and look at forecasts out to as far as 16 days.

View more weather maps.

Zoom Out

Area snowfall accumulation expected around Dane County, Wisconsin

This is snowfall forecast, with amounts anticipated in the next 24 hours. This guidance is from the HRRR weather model. For more model forecasts out to 16 days, visit our main weather forecast maps page.

View more weather maps.

These are Convective Outlooks from the Storm Prediction Center. Click to see Days 1-3 broken down into Tornado, Wind and Hail threats, as well as days 5-8 outlooks.

View more weather maps.

Atlantic Hurricane and Tropical Storm Tracking Map
Add this hurricane tracker to your site:
<div style='text-align:center'><a href='https://www.f5wx.com/models/hurricane/atlantic.png'>
<img src='https://www.f5wx.com/models/hurricane/atlantic.png' alt='F5Weather Atlantic Hurricane and Tropical Storm Tracking Map'>
<p>Hurricane Tracking from F5Weather</a></div>

Our hurricane tracking map monitors for any current or forecast tropical disturbances in the Atlantic. (See our Pacific Hurricane Tracker) Various hurricane models will draw a 'spaghetti plot' in the Atlantic Basin when a disturbance is forecast or exists, showing the system's forecast track. Once a storm has developed, the National Hurricane Center will forecast their official track. This will show up on the map along with the storm's current intensity, track and name. We will also plot some of the storm's vitals and of course the spaghetti plots from the models along with the NHC forecast track will give you an idea of where it's heading, and its forecast intensity with time.

View more weather maps.

F5Weather Maps splash

To view the latest computer models, visit f5wx.com for access to the weather maps and guidance that meteorologists use to make their forecasts.
 
Get access to:
  • European ECMWF HRES
  • American GFS
  • Canadian GDPS GEM
  • German DWD ICON
  • British MetOffice's UKMET Unified Model
  • American NAM
  • American HRRR
  • American NBM - National Blend of Models
  • GEFS, GEPS, MOGREPS & European Ensembles
  • Probabilities & Averages
  • 3-Ensemble Mean & more!
View Skew-T soundings, textual data tables for your location, and of course maps! Weather forecast maps of the basics like temperature, wind, pressure, humidity, dew point, cloud cover, simulated radar, travel weather, rainfall and snow are available. More advanced users can also get use out of our severe weather & tornado threat maps, as well as upper air & shear graphics.
 
See the latest forecast data as the models update.
 
F5Weather Maps

Climate Summary
(made with AI, use with caution)
Middleton, Wisconsin Climate Summary

General Climate

    •   Middleton, Wisconsin has a humid continental climate, with cold, snowy winters and warm, humid summers.
    •   The city experiences four distinct seasons, with average temperatures ranging from 20°F (-7°C) in January to 75°F (24°C) in July.
    •   Middleton receives an average of 32 inches (81 cm) of precipitation per year, with the majority falling as rain during the spring and summer months.
    •   The city is also prone to severe weather, including thunderstorms, tornadoes, and blizzards.

Temperature

    •   The average annual temperature in Middleton is 47°F (8°C).
    •   The warmest month is July, with an average temperature of 75°F (24°C).
    •   The coldest month is January, with an average temperature of 20°F (-7°C).
    •   The highest temperature ever recorded in Middleton was 109°F (43°C) on July 13, 1936.
    •   The lowest temperature ever recorded in Middleton was -40°F (-40°C) on January 20, 1985.

Precipitation

    •   Middleton receives an average of 32 inches (81 cm) of precipitation per year.
    •   The majority of the precipitation falls as rain during the spring and summer months.
    •   The wettest month is June, with an average of 4.5 inches (11 cm) of precipitation.
    •   The driest month is February, with an average of 1.5 inches (4 cm) of precipitation.
    •   Middleton is also prone to severe weather, including thunderstorms, tornadoes, and blizzards.

Snowfall

    •   Middleton receives an average of 42 inches (107 cm) of snow per year.
    •   The majority of the snowfall occurs during the winter months, from December to March.
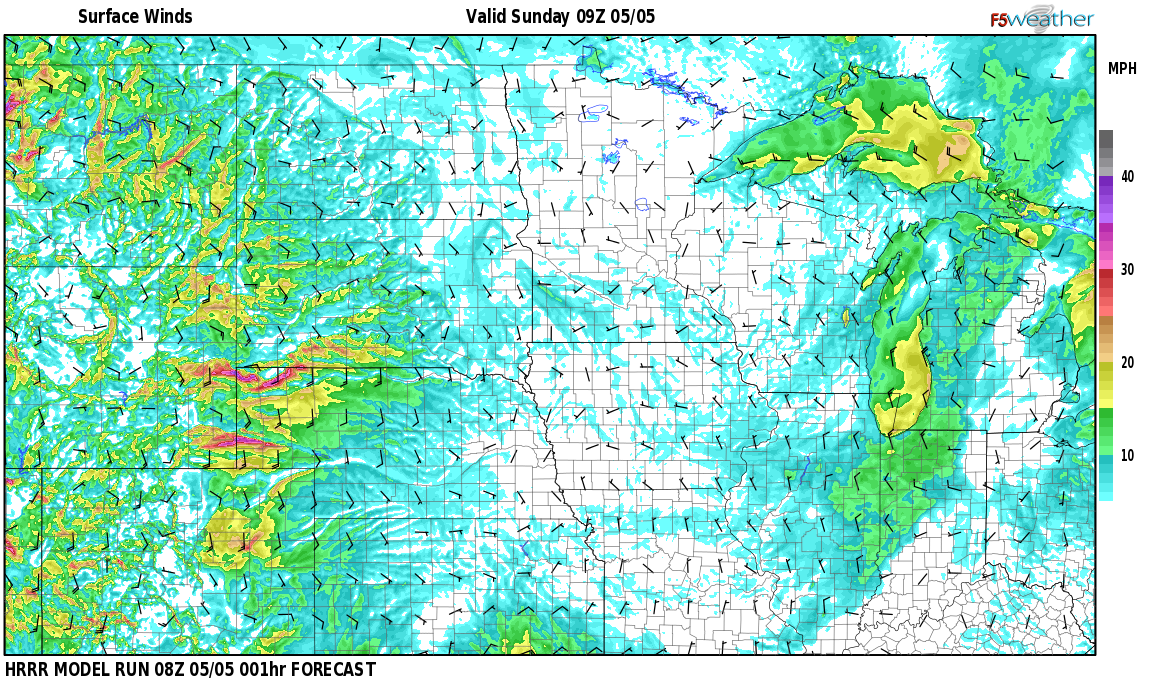
    •   The snowiest month is January, with an average of 10.5 inches (27 cm) of snow.

Wind

    •   The prevailing wind direction in Middleton is from the west.
    •   The average wind speed is 10 mph (16 km/h).
    •   The strongest winds typically occur during the winter months, when the jet stream is strongest.

Climate Change

    •   The climate in Middleton is changing, as it is in the rest of the world.
    •   The average annual temperature has increased by about 2°F (1°C) since the late 19th century.
    •   The number of days with extreme heat has also increased.
    •   The climate change is also leading to more frequent and severe weather events, such as thunderstorms, tornadoes, and blizzards.

Facts & Historical Information
(made with AI, use with caution)
Natural History

    •   Middleton is home to the Pheasant Branch Conservancy, a 385-acre nature preserve featuring wetlands, prairies, and forests.

    •   The Yahara River, a tributary of the Rock River, flows through Middleton, providing habitat for diverse aquatic life.

    •   The city's parks, including Goodland Park and Greenway Station Park, offer opportunities for wildlife observation and outdoor recreation.

Science

    •   Middleton is the site of the University of Wisconsin-Madison's Middleton Experimental Farm, a 600-acre research facility specializing in agricultural science.

    •   The city is home to several biotechnology and medical technology companies, contributing to the region's reputation as a hub for biomedical research.

Personalities

    •   Frank Lloyd Wright, the renowned architect, designed the Jacobs House in Middleton in 1937.

    •   Aldo Leopold, the conservationist and author of \

Tourist Attractions
1.The American Players Theatre

is a Tony Award-winning theatre company that performs in an outdoor amphitheater in Spring Green, Wisconsin. The theatre is known for its high-quality productions of Shakespeare and other classical plays.

2.Taliesin

is the home and studio of Frank Lloyd Wright, one of the most famous architects in the world. Taliesin is located in Spring Green, Wisconsin, and is open to the public for tours.

3.The House on the Rock

is a unique and eclectic museum located in Spring Green, Wisconsin. The museum features a variety of exhibits, including a carousel, a music machine, and a collection of dolls.

Nearby Cities:

Shorewood Hills, WI
Madison, WIMaple Bluff, WI
Verona, WIWaunakee, WI
Cross Plains, WIMonona, WI
Fitchburg, WIDane, WI
McFarland, WIWindsor, WI
Oregon, WIBlack Earth, WI
Mount Horeb, WIDe Forest, WI
Roxbury, WICottage Grove, WI
Milwaukee, WI
Aurora, ILRockford, IL
Naperville, ILElgin, IL
Davenport, IAKenosha, WI
Waukegan, ILBelmont Cragin, IL
Racine, WIArlington Heights, IL
Evanston, IL